Visual Analytics enables a more direct method to present network traffic than traditional charts.
CySight provides a number of easy options to enhance the interactive analysis on Visualizations.
Time periods, timezones or display fields can be changed and the Criteria of the Visualization can be defined.
Visualization analysis are also available via right-click drilldown menus or accessible by using the left-menu to inherit periods and criteria from other visual analytics, multiviews or forensic perspectives.
This provides an unprecedented granularity and flexibility for performance monitoring, bandwidth utilization, absolute network visibility for root cause analysis and forensics. Coupled with superior scalability CySight exceeds the capabilities of any other Netflow analyzer.
CySight visualizations support Threats, IP, Account, CostCentre, AS and Interface "Point-to-Point" traffic graphs using unique visual techniques:
- Dashboards,
- Geolocation,
- CirclePacks,
- Sankey,
- Topology,
- Force graphs,
- Chords and
- Bundles
You will need an html5 compatible browser to see the visualizations.The Dashboards
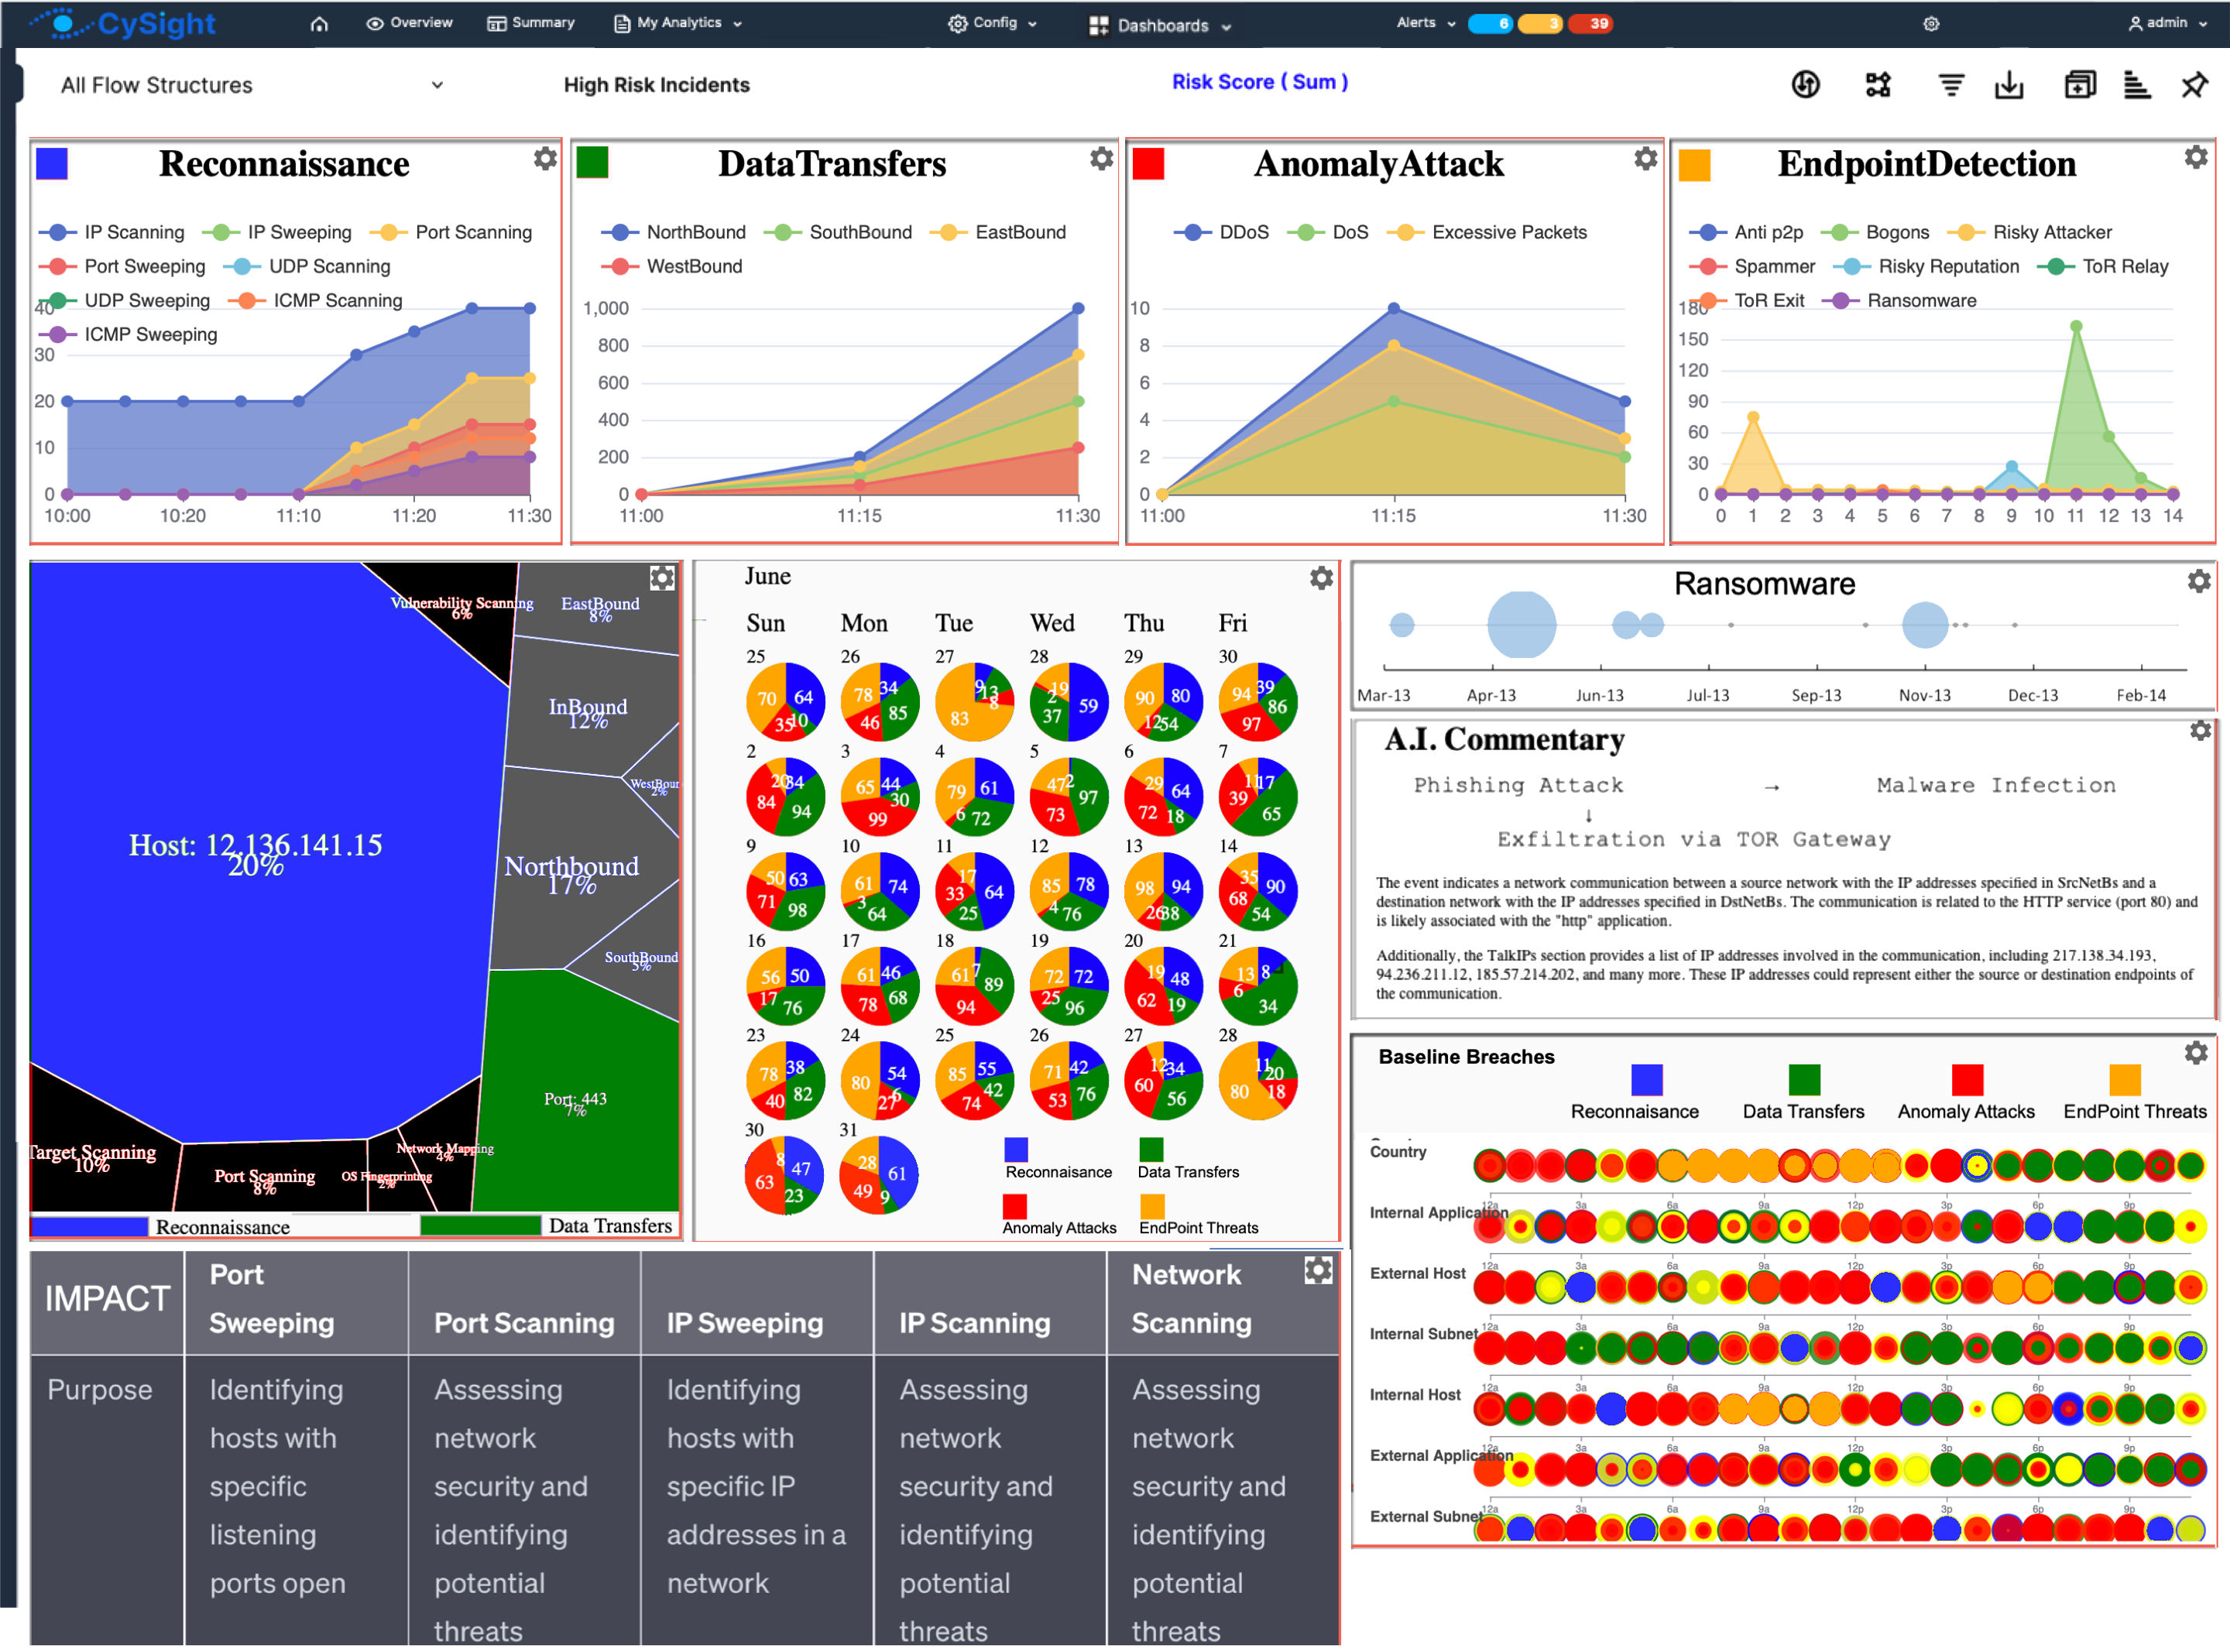
CySight Dashboards enable multiple views on a single screen. It brings to the fore our latest AI technology enabling continual analysis and mitigation. Smart widgets allow you to see exactly what is happening in milliseconds of an attack followed by an AI Diagnostics of what happened and a Threat Diagnostics of Lateral Attacks and Predictive AI Impact analysis.
GA Availability September 2023. Beta availability August 2023.
Geolocation View
CySight connects the dots of traffic flowing into and out from the organization with zoom and mouseover analytics. Any aspect of data flows can be mapped. Default Threat Mapping reflects all threats and their end-points.
Circlepacks
CySight Circlepacking provides a circlular treemapping analysis that simplifies complex data and groups into circle hierarchy with complete control over what is filtered and which fields form the analysis. The order of the fields can be changed at any time. Here we see a quick analysis using Circlepacks identifying High Risk end points and then using Sankey to see further.
The Sankey
CySights's Sankey view enables you to follow the relationship between different aspects. In this case lets follow the Threats and analyze from Circlepack to Sankey to Forensics.
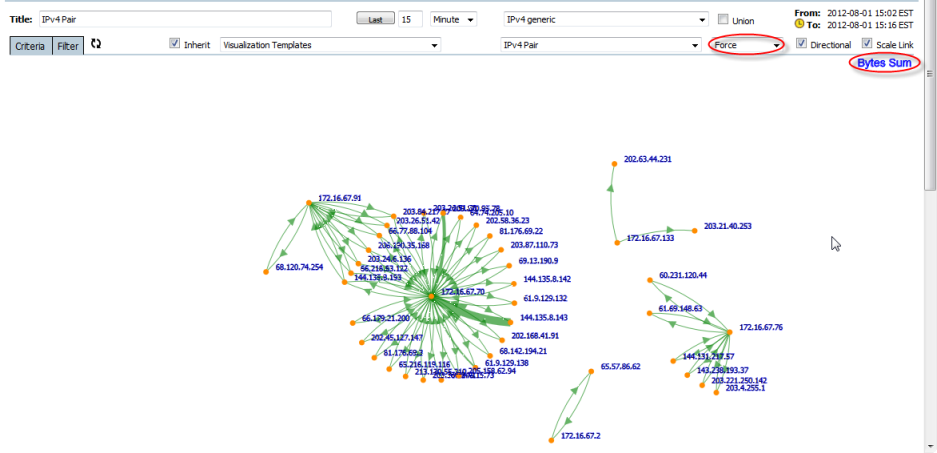
The Force Graph
Presents direct point-to-point Interface, Account, CostCentre, AS, and IP pair traffic relationships. The scale arc shows the traffic measurement between two nodes.
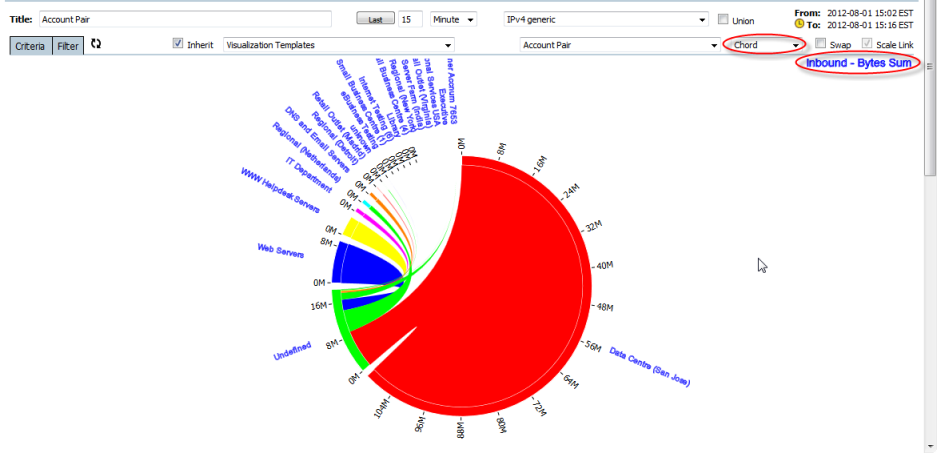
The Chord Graph
Presents a matrix network traffic analysis, the arc band presents each pair traffic, and the width at the end of band shows the pair traffic volume from inbound or outbound perspective.
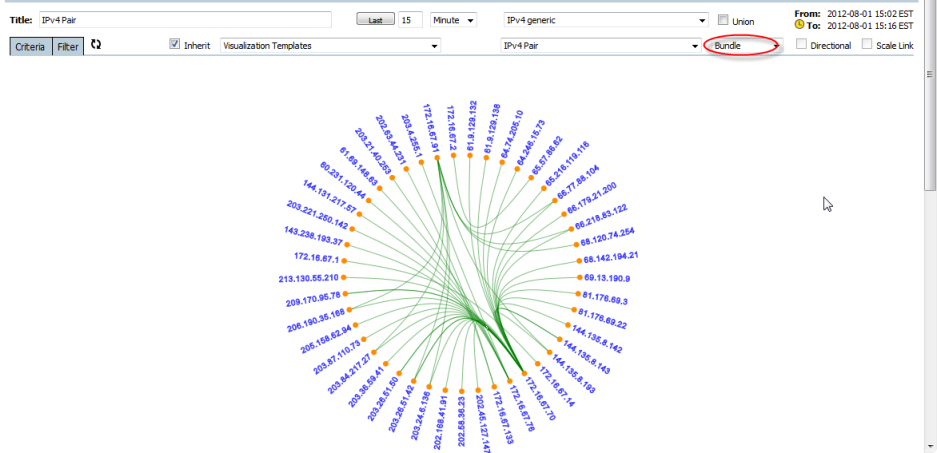
The Bundle Graph
Clearly shows a Pair matrix relationship, but does not show traffic measurement such as that shown in a chord graph.